
TCP Ports Explained for Smarter Service Monitoring
TCP ports explained for IT teams: learn how port monitoring works, what to track, and how to reduce false alerts before outages spread.
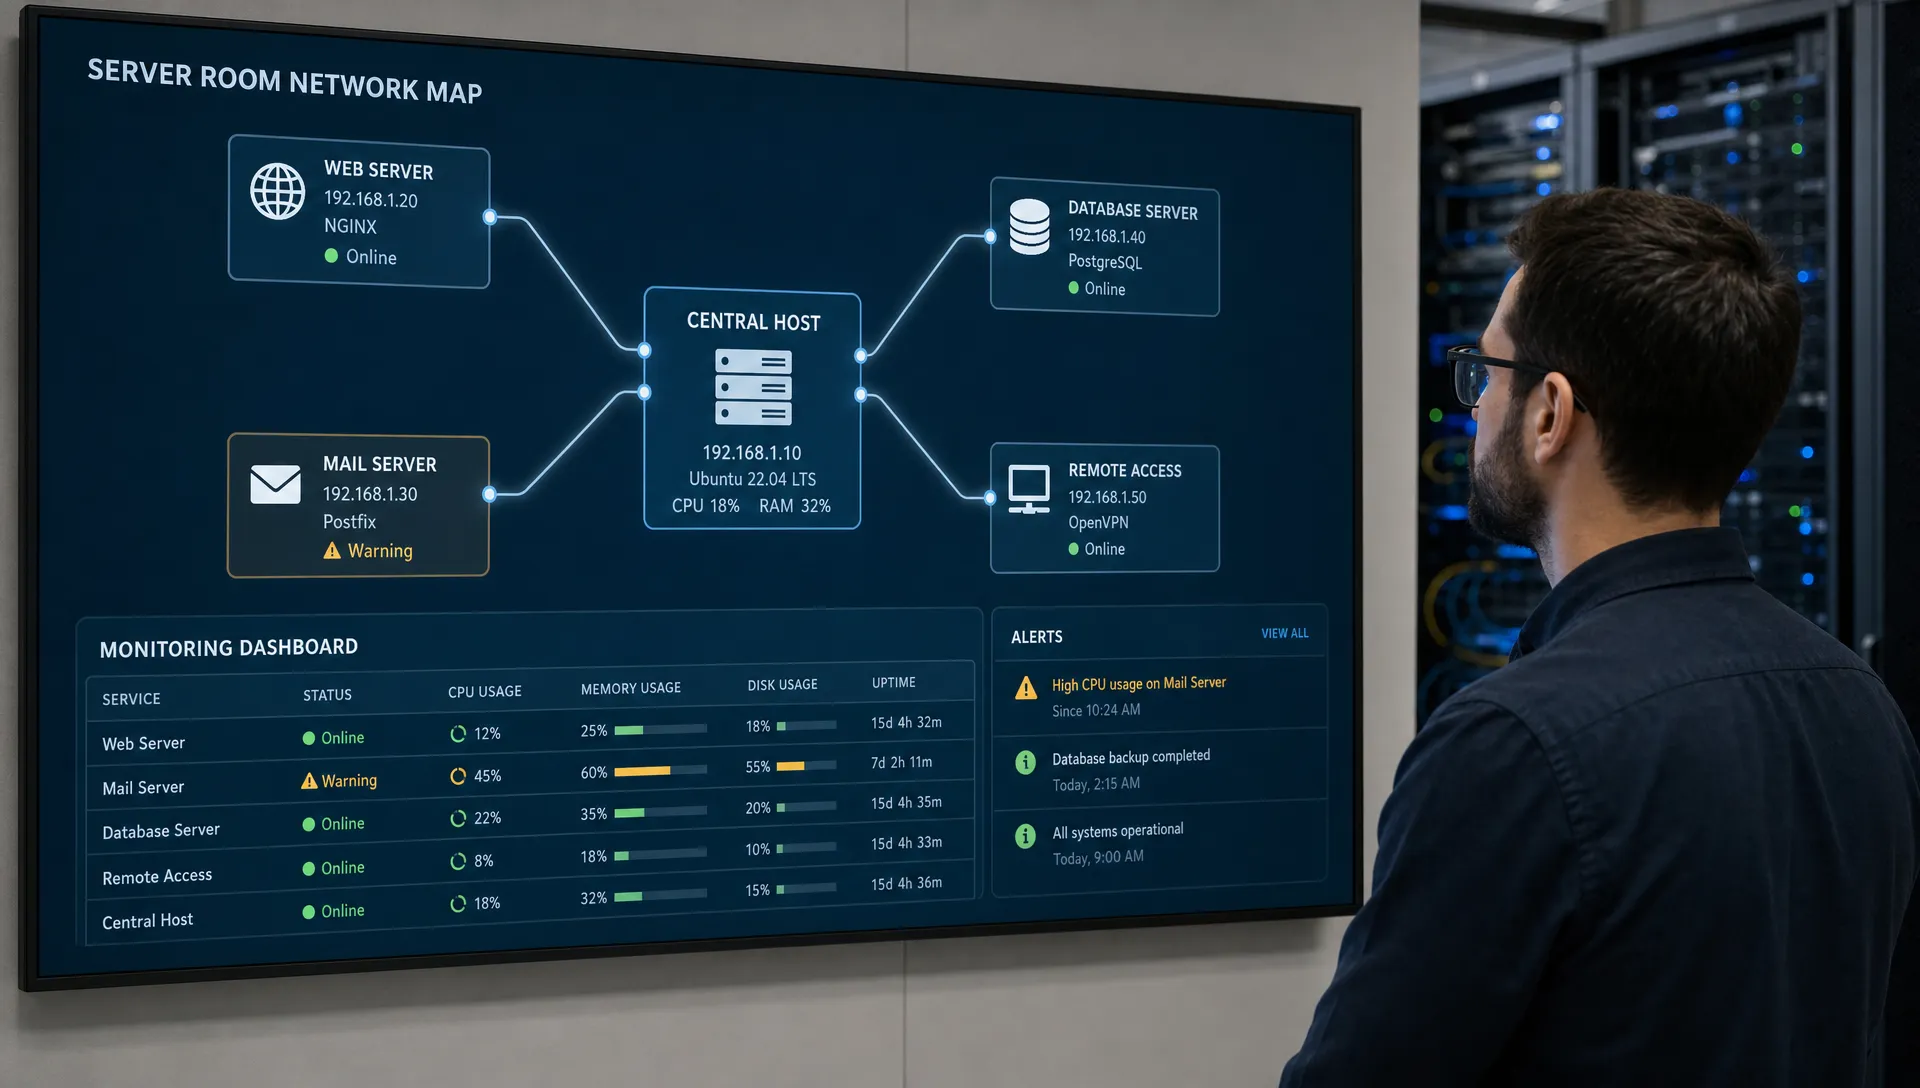
TCP ports are easy to overlook until a critical service stops accepting connections. A website may still resolve in DNS, a server may still respond to ping, and yet the service your users need is effectively down because the right port is closed, filtered, overloaded, or listening on the wrong interface.
For IT teams, MSPs, and infrastructure owners, understanding TCP ports is not just networking trivia. It is the foundation for smarter service monitoring. When you know which ports matter, what a port check proves, and what it does not prove, you can build alerts that detect real failures earlier without creating unnecessary noise.
What TCP ports actually do
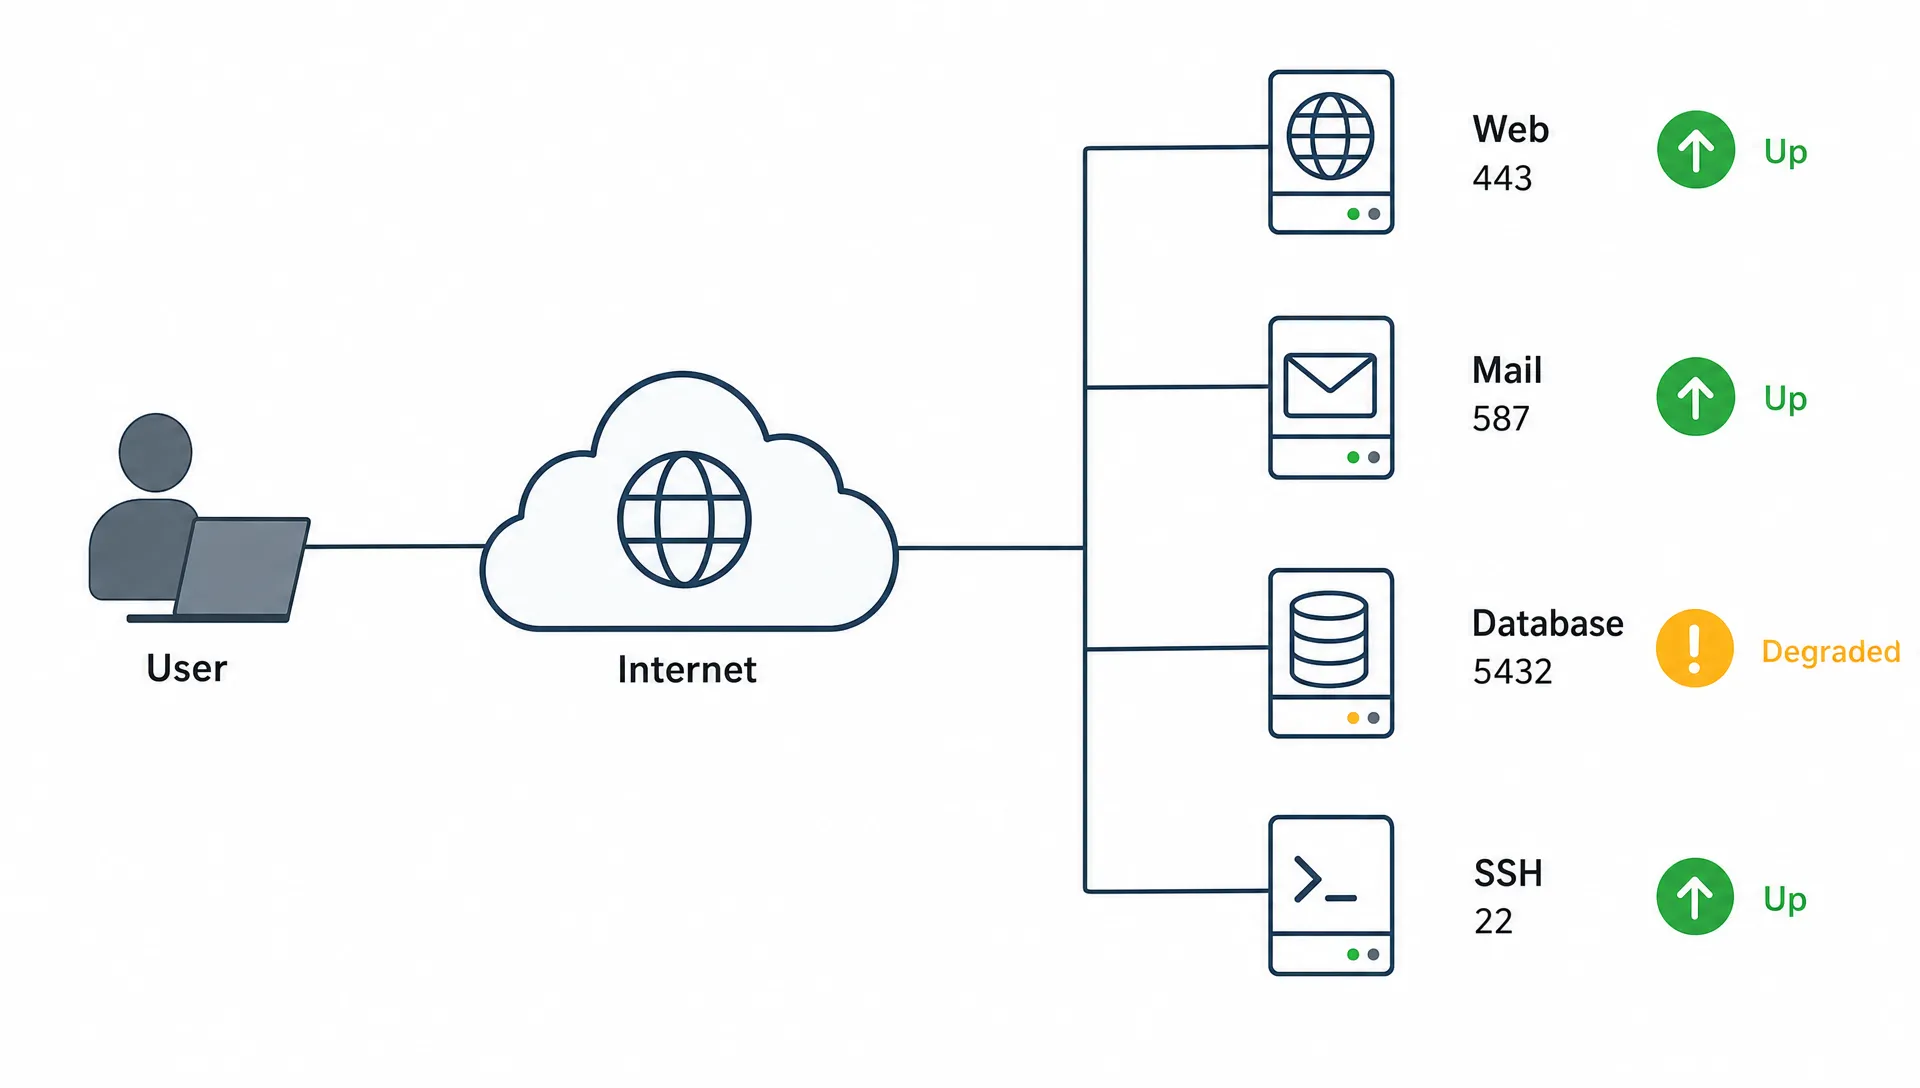
An IP address identifies a host or network interface. A TCP port identifies the application service that should receive a connection on that host. TCP, defined in RFC 9293, provides reliable, ordered communication between two endpoints. Ports make it possible for one server to run multiple services at the same IP address, such as HTTPS on port 443, SSH on port 22, and SMTP on port 25.
When a client connects to a service, it usually connects from a temporary source port to a known destination port. For example, a browser may use a random high-numbered local port to connect to a web server on TCP 443. The server listens on 443 because that is the convention for HTTPS.
The IANA Service Name and Transport Protocol Port Number Registry maintains official port assignments, but real environments often differ. A development API might run on 8443, a legacy admin interface might use 8080, and a private database might be bound to a nonstandard port. For monitoring, the configured service reality matters more than the default convention.
Common TCP ports worth knowing
Not every TCP port deserves an alert. The goal is to monitor the ports that represent customer impact, operational risk, or important dependencies. The table below summarizes common TCP ports and why teams often track them.
| TCP port | Common service | Why it matters for monitoring |
|---|---|---|
| 22 | SSH | Remote administration may be unavailable if the port stops accepting connections. |
| 25 | SMTP | Mail transfer can fail even if the mail server itself is powered on. |
| 53 | DNS over TCP | DNS often uses UDP, but TCP matters for large responses, zone transfers, and some resolver scenarios. |
| 80 | HTTP | Plain HTTP services, redirects, and legacy endpoints may depend on this port. |
| 443 | HTTPS | Most public websites, APIs, and secure applications depend on this port. |
| 465 | SMTPS | Encrypted mail submission or legacy secure SMTP may rely on this listener. |
| 587 | SMTP submission | Common for authenticated outbound mail submission. |
| 993 | IMAPS | Secure mailbox access can break while other mail services remain healthy. |
| 3306 | MySQL or MariaDB | Application databases may be reachable only from internal networks, but connection availability still matters. |
| 5432 | PostgreSQL | A closed or timing-out database port can quickly become an application outage. |
| 6379 | Redis | Caches and queues can create cascading failures when the listener is unavailable. |
| 8080 or 8443 | Alternate HTTP or HTTPS | Common for application servers, proxies, admin panels, and staging services. |
Treat this table as a starting point, not a universal checklist. A port that is critical in one environment may be irrelevant in another. The best monitoring strategy starts with the services your users and internal systems actually depend on.
What a TCP port monitor really verifies
A TCP port monitor typically attempts to establish a TCP connection to a specific hostname or IP address and port. If the TCP handshake completes, the monitor knows the service is accepting connections at that network layer. If the connection is refused, times out, or takes too long, the monitor records a failure or degraded result.
That low-level signal is valuable because it answers a focused question: can a client reach this service listener right now? It does not necessarily validate authentication, business logic, application responses, database queries, or page rendering. That limitation is not a weakness. It is what makes TCP checks fast, clear, and useful as part of a layered monitoring strategy.
| TCP check result | Common meaning | What to investigate next |
|---|---|---|
| Connection accepted | The port is open and the service is listening. | Confirm higher-level application health if users still report issues. |
| Connection refused | The host is reachable, but nothing is accepting connections on that port. | Check whether the service stopped, crashed, or is bound to the wrong interface. |
| Connection timeout | Traffic is dropped, filtered, routed incorrectly, or the host is unreachable. | Check firewall rules, network paths, upstream outages, and host availability. |
| Slow connection | The service eventually accepts connections, but latency is abnormal. | Check load, network congestion, packet loss, resource exhaustion, or firewall inspection delays. |
| Intermittent failures | Some checks pass and others fail. | Look for saturation, connection limits, regional routing issues, or unstable dependencies. |
Some services log every connection attempt, enforce rate limits, or treat repeated probes as suspicious. For those services, tune check intervals and timeouts carefully so monitoring stays helpful without creating avoidable noise.
Why TCP port monitoring is smarter than ping alone
Ping checks are useful for basic reachability, but they only show whether ICMP echo traffic receives a response. Many production networks block ICMP, deprioritize it, or allow it even when application traffic is broken. A server can respond to ping while its web server, database listener, or mail daemon is down.
TCP port monitoring is closer to the user experience because it tests the actual path to a service. If customers connect to TCP 443, partners connect to TCP 587, or an application connects to TCP 5432, then monitoring those ports gives you a more relevant availability signal than host reachability alone.
At the same time, a TCP port check is not the same as full application monitoring. Port 443 can be open while the site returns HTTP 500 errors. Port 25 can accept a connection while mail delivery fails later in the pipeline. Port 5432 can accept a socket while a specific query fails because of permissions, locks, or replication lag.
That is why smart teams layer checks. A broader approach might include ping for host reachability, TCP checks for listener availability, HTTP or API checks for application responses, SSL checks for certificate validity, and DNS checks for resolution changes. If you want a wider framework for this layered model, MyMonitor365 has a guide to monitoring your full infrastructure stack.
| Monitor type | Confirms | Does not fully confirm |
|---|---|---|
| Ping or ICMP | The host or network path may be reachable. | The application service is accepting connections. |
| TCP port | A specific service listener accepts TCP connections. | The application returns correct content or completes transactions. |
| HTTP or API | A web endpoint returns an expected response. | The underlying network path is healthy for every dependency. |
| SSL | A certificate is valid and not nearing expiry. | The application behind the certificate is functioning correctly. |
| DNS | A domain resolves as expected. | The resolved service is accepting connections. |
How to choose which TCP ports to monitor
Start with the service promise. If users expect a website to be reachable, monitor TCP 443 and pair it with HTTP and SSL checks. If customers send mail through your systems, monitor the relevant SMTP ports. If an internal application cannot function without PostgreSQL, monitor TCP 5432 from the network location that resembles the application path.
For MSPs, this mapping is especially important because different clients may use similar technologies in very different ways. One client may expose only HTTPS publicly. Another may depend on a VPN, mail submission, RDP gateway, or industry-specific TCP service. A generic port list will miss the context that determines whether an outage is urgent.
A practical service inventory should answer five questions for each monitored port:
- Which business service depends on this TCP port?
- Who owns the service when the alert fires?
- From which location should the port be reachable?
- What timeout or failure pattern indicates real user impact?
- Which higher-level checks should confirm the incident?
Once those answers are documented, TCP monitoring becomes much more than a basic up or down test. It becomes a precise signal connected to ownership, impact, and response.
Designing smarter TCP port checks
The best port checks are specific. Instead of monitoring every discovered port, define expected service endpoints. Use the hostname users rely on where possible, especially when DNS, load balancers, or proxies are part of the real path. Use the direct IP address when you specifically want to test a server or device behind a name.
Multi-location monitoring is useful when reachability varies by region, ISP, cloud provider, or firewall path. A service may be reachable from your office but unavailable from another region. It may work from inside a private network but fail externally. By comparing results from multiple locations, teams can distinguish local routing problems from global service failures.
Timeouts also matter. A very short timeout may create false positives during brief congestion. A very long timeout may delay detection of a service that is technically reachable but unusably slow. Set thresholds based on the role of the port. Public web and API services usually deserve tighter thresholds than low-priority internal admin services.
Maintenance windows should be part of the plan. If a port is expected to close during patching, certificate work, firewall changes, or service migration, suppressing routine alerts during that window keeps responders focused on unexpected incidents. Historical incident records still matter, but not every expected interruption needs to wake someone up.
Reducing false alerts without missing real outages
Alert quality is where TCP port monitoring succeeds or fails. A port check that fires too aggressively becomes background noise. A check that is too relaxed misses the early warning signs that monitoring is supposed to catch.
One common problem is alert storms. If a firewall, router, cloud region, or upstream provider fails, dozens of downstream ports may all appear down at once. The services are not individually failing. They are symptoms of a shared dependency. In those cases, dependency-aware monitoring helps teams focus on the likely root cause. MyMonitor365 explains this approach in its article on monitor dependencies and smarter alert suppression.
Another common problem is treating every port with the same urgency. A failed public HTTPS port at peak hours may require immediate escalation. A closed staging SSH port may only need a ticket. A database port that fails from the application subnet may be critical, while the same database port should never be reachable from the public internet.
Good alert design should include severity, ownership, expected reachability, and context. The notification should tell responders which host and port failed, where the check failed from, how long it has been failing, and what service is affected. Alert integrations then ensure the message lands where the responsible team already works.
TCP port monitoring as a security and change signal
TCP monitoring is not a vulnerability scanner, but it can still reveal security-relevant changes. If an expected secure service closes unexpectedly, users may lose access. If a sensitive service appears reachable from a location where it should not be exposed, that may indicate a firewall or routing change that deserves investigation.
For example, SSH on port 22 may be appropriate for a hardened jump host but inappropriate for a public application server. Redis on port 6379 may be essential inside a private network but risky if exposed broadly. SMTP ports may be intentionally available on a mail server but suspicious on a web-only host.
The key is to compare monitoring results against an approved service inventory. Expected open ports should remain open from the right places. Restricted services should only be reachable from approved networks. When changes happen, the team should be able to tie them to a deployment, maintenance window, or firewall update.
This is also where audit logs and operational discipline matter. The faster you can correlate a port status change with a configuration change, the faster you can decide whether you are seeing a normal deployment, a mistake, or a potential incident.
A practical TCP port monitoring model
A strong monitoring setup connects each port check to companion checks. That way, your team can separate network reachability from application correctness.
| Service category | TCP ports to consider | Companion checks | Alert priority |
|---|---|---|---|
| Public website or SaaS app | 80, 443, 8080, 8443 | HTTP or API response, SSL expiry, DNS resolution | High for production endpoints |
| Mail service | 25, 465, 587, 993 | DNS and MX checks, SMTP-specific monitoring where available | High if customer mail depends on it |
| Database dependency | 3306, 5432 | Host reachability, application health, logs, internal network checks | High for production app dependencies |
| Cache or queue | 6379 and service-specific ports | Application health, host metrics, internal reachability | Medium to high depending on architecture |
| Administrative access | 22, 3389, VPN ports | Ping, access policy review, maintenance schedule | Context dependent |
| DNS infrastructure | 53 over TCP where relevant | DNS query checks and resolution validation | High for authoritative or critical resolvers |
This model prevents a common mistake: assuming one green check means the whole service is healthy. Instead, each layer contributes evidence. If TCP 443 is down, the problem may be network, firewall, load balancer, or web server. If TCP 443 is up but HTTP fails, the issue is likely higher in the stack. If HTTP is fine but SSL is expiring, the incident is not yet an outage, but it can become one quickly.
Common mistakes when monitoring TCP ports
Many port monitoring problems come from unclear intent. Teams add checks because ports exist, not because they understand what the service represents. Over time, nobody knows which alerts matter, which are legacy, and which are safe to ignore.
| Mistake | Why it causes problems | Better approach |
|---|---|---|
| Monitoring every open port | Creates noisy alerts with unclear ownership. | Monitor business-critical and dependency-critical ports first. |
| Checking only from one location | Misses regional, ISP, or firewall-specific failures. | Use monitoring locations that reflect real users and systems. |
| Relying only on TCP 443 for web apps | Confirms the listener, not the application response. | Pair TCP checks with HTTP or API checks. |
| Using identical thresholds for all services | Low-priority and high-priority ports generate the same urgency. | Match timeout, retry, and escalation rules to business impact. |
| Ignoring maintenance windows | Expected work creates unnecessary incidents. | Schedule maintenance windows for planned service changes. |
| Not documenting owners | Alerts take longer to triage. | Assign each monitored port to a team, client, or service owner. |
Port monitoring works best when it is intentional. A small number of well-designed checks is usually more valuable than hundreds of generic probes with no response plan.
Frequently Asked Questions
What is a TCP port in simple terms? A TCP port is a numbered endpoint that directs network traffic to a specific service on a host. The IP address gets traffic to the machine, and the port gets it to the right application service.
Which TCP ports should I monitor first? Start with ports tied to customer-facing services and critical dependencies. Common examples include 443 for HTTPS, 25 or 587 for mail, 5432 for PostgreSQL, 3306 for MySQL, and any nonstandard ports your production applications rely on.
Is TCP port monitoring the same as website monitoring? No. TCP port monitoring confirms that a service is accepting connections on a port. Website monitoring, such as HTTP or API checks, confirms that the application returns an expected response. Most production websites should use both.
What does a TCP port timeout mean? A timeout usually means the connection attempt did not receive a clear response. Causes can include firewall filtering, routing problems, packet loss, an unreachable host, or a service that is too overloaded to respond in time.
Can TCP port monitoring help with security? Yes, as a change signal. It can help teams notice when expected services disappear or when sensitive services appear reachable from places they should not be. It should complement, not replace, vulnerability scanning and firewall management.
How often should TCP ports be checked? The right interval depends on business impact. Critical public services often need frequent checks, while lower-priority internal services may tolerate longer intervals. Balance detection speed with noise, service sensitivity, and operational cost.
Build smarter service monitoring with MyMonitor365
TCP ports tell you whether the services your users and systems depend on are actually accepting connections. When you combine those checks with HTTP/API monitoring, ping and ICMP checks, SSL expiry alerts, DNS change monitoring, multi-location checks, maintenance windows, and well-routed alerts, you get a clearer picture of availability across the stack.
MyMonitor365 helps IT teams and MSPs monitor websites, servers, DNS, SSL, and network services with instant alerts and practical controls for real operations. If you want to catch service failures before users notice, start with the ports that matter most, then build a monitoring strategy around the full service path.