
How to Monitor Network Infrastructure Without Blind Spots
Learn how to monitor network infrastructure without blind spots using layered checks for uptime, DNS, SSL, ports, alerts, and dependencies.
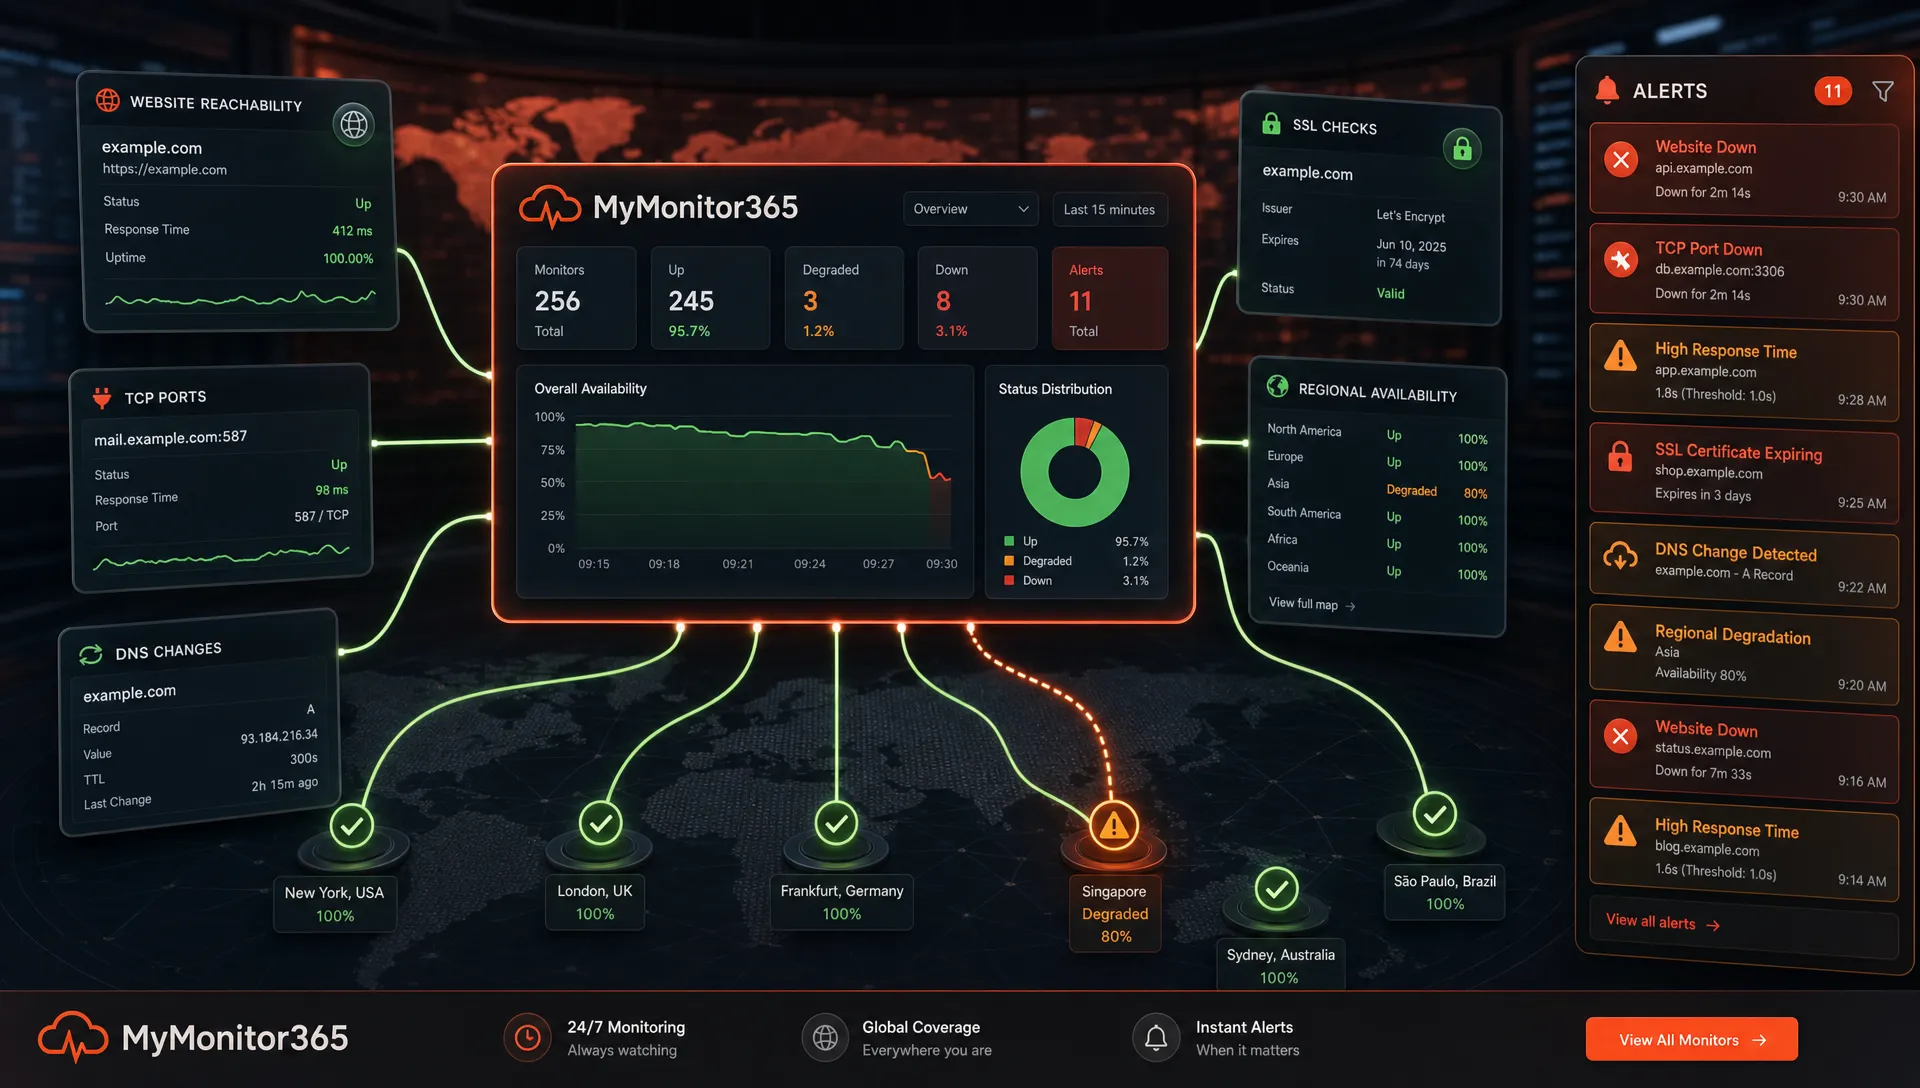
Blind spots in network infrastructure rarely announce themselves. They usually appear as confusing edge cases: a site works from your office but fails in another region, a port is open but the service behind it is broken, a certificate renews but the chain is incomplete, or DNS changes silently point traffic to the wrong place.
For IT teams and MSPs, the goal is not simply to know whether something is “up.” The goal is to know whether each critical service is reachable, responsive, correctly configured, secure enough to trust, and monitored from the perspective of the people and systems that depend on it.
A blind-spot-free monitoring strategy starts with layered checks, realistic dependency mapping, and alerting that distinguishes real incidents from noise.
What “blind spots” mean in network infrastructure monitoring
A monitoring blind spot is any condition that can affect users, customers, or downstream systems without triggering a useful alert. The infrastructure may technically be monitored, but the monitoring does not cover the failure mode that matters.
Common examples include:
- A server responds to ping, but the HTTPS application is returning 500 errors.
- A TCP port is open, but the API response contains the wrong content.
- A website loads in one region, but fails for users routed through another provider.
- A certificate exists, but it is expired, misconfigured, or missing an intermediate certificate.
- A DNS record changes unexpectedly, but no one notices until traffic breaks.
- A maintenance window suppresses too much, hiding an unrelated incident.
This is why monitoring network infrastructure requires more than one signal. Ping alone is not enough. HTTP status alone is not enough. Logs alone are not enough. A resilient monitoring setup uses multiple checks that confirm the service from different angles.
| Blind spot | What users experience | Why basic monitoring misses it | Better monitoring signal |
|---|---|---|---|
| Server reachable, app broken | Website or API errors | Ping still succeeds | HTTP/API response checks |
| Port open, wrong service behavior | Login, checkout, or sync fails | TCP check only confirms connection | Keyword or content validation |
| Regional routing issue | Some users cannot connect | Single-location check passes | Multi-location monitoring |
| DNS misconfiguration | Traffic goes to the wrong endpoint | Host remains online | DNS change monitoring |
| SSL/TLS issue | Browser warning or failed secure connection | HTTP-only checks miss certificate health | SSL certificate monitoring |
| Alert fatigue | Incidents are ignored | Too many noisy alerts | Dependency-aware alerting and escalation |
Start with a real service inventory, not just a device list
Many monitoring programs begin with a list of devices: routers, switches, servers, firewalls, load balancers, databases, and endpoints. That inventory matters, but it is not enough to eliminate blind spots.
Users do not experience your infrastructure as a device list. They experience services: the customer portal, VPN access, DNS resolution, payment workflows, support systems, APIs, authentication, email delivery, and internal tools.
To monitor network infrastructure without blind spots, create a service inventory that connects infrastructure components to business outcomes. For each critical service, document:
- The public or private endpoint users depend on.
- The DNS records that route traffic to it.
- The ports and protocols required for access.
- The certificate or security layer required for trust.
- The upstream dependencies, such as identity providers, CDN services, databases, and network links.
- The team or person responsible for response.
- The expected response time, uptime target, and escalation path.
This turns monitoring from “is the box alive?” into “can the service fulfill its purpose right now?” If you need a broader framework for mapping checks across the entire stack, MyMonitor365’s guide to monitoring your full infrastructure stack is a useful companion to this blind-spot-focused approach.
Layer monitoring from the network edge to the user experience
A strong monitoring model is layered. Each layer answers a different question. When combined, they help you understand whether an incident is caused by connectivity, service availability, configuration, security, or application behavior.
Network reachability checks
Ping and ICMP checks are useful for confirming whether a host is reachable at a basic network level. They are especially helpful for routers, firewalls, VPN gateways, branch office endpoints, and infrastructure that may not expose an HTTP service.
But ICMP has limits. Some environments block it. Some hosts respond to ping even when the application is down. Treat ping as an early signal, not the whole truth.
TCP port monitoring
TCP port checks confirm whether a service is accepting connections on a specific port. This is important for services such as SSH, RDP, database endpoints, SMTP, VPN ports, and custom applications.
Port monitoring answers a specific question: “Can a connection be established?” It does not prove the service is functioning correctly after connection. For that, pair port checks with higher-level checks when possible.
HTTP and API monitoring
HTTP and API checks validate web services from the outside. They can confirm status codes, response time, endpoint availability, and whether an API is returning an expected response.
This layer is essential for customer-facing websites, internal web apps, dashboards, SaaS integrations, and API-driven workflows. A web server that responds with a 200 status but returns the wrong page can still be broken, so content or keyword checks can add another layer of assurance.
SSL and TLS monitoring
SSL and TLS issues are operational incidents, not just security housekeeping. An expired certificate, invalid chain, hostname mismatch, or weak configuration can make a service unreachable or untrusted.
Certificate monitoring should cover expiration dates and certificate validity for every important HTTPS endpoint, including APIs, admin panels, customer portals, and secondary domains that may be forgotten until renewal fails.
DNS monitoring
DNS is one of the most common infrastructure blind spots because it often changes outside normal deployment workflows. A single record update can redirect users, break email, affect failover, or expose stale infrastructure.
DNS monitoring helps detect unexpected changes in A, AAAA, CNAME, MX, TXT, and other records that influence traffic routing, verification, email delivery, and service discovery.
Build a coverage matrix for every critical service
Once you understand the layers, create a coverage matrix. This gives IT teams and MSPs a quick way to see whether each service has enough monitoring depth.
| Service | Ping/ICMP | TCP port | HTTP/API | SSL/TLS | DNS | Multi-location | Content check |
|---|---|---|---|---|---|---|---|
| Public website | Optional | Yes | Yes | Yes | Yes | Yes | Yes |
| Customer API | Optional | Yes | Yes | Yes | Yes | Yes | Optional |
| VPN gateway | Yes | Yes | No | Optional | Yes | Optional | No |
| DNS provider records | No | No | No | No | Yes | Yes | No |
| Admin dashboard | Optional | Yes | Yes | Yes | Yes | Optional | Yes |
| Mail gateway | Yes | Yes | Optional | Optional | Yes | Optional | No |
The point is not to monitor everything in the same way. The point is to apply the right checks based on how the service fails and who is affected when it does.
Use multi-location monitoring to catch regional failures
A service can be healthy from one location and broken from another. This is especially true in 2026 environments that rely on cloud regions, CDNs, Anycast DNS, ISP routing, global users, and distributed teams.
Single-location monitoring creates a dangerous assumption: if your monitoring node can reach the service, users can too. That assumption fails during regional outages, routing leaks, DNS propagation issues, CDN misconfigurations, and provider-specific packet loss.
Multi-location monitoring helps answer better questions:
- Is the service reachable from multiple regions?
- Is latency increasing only in one geography?
- Are failures isolated to one network path?
- Is DNS resolving consistently from different locations?
- Is a CDN or edge configuration affecting only some users?
For MSPs, multi-location checks are especially valuable because clients may be distributed across cities, countries, or hybrid work environments. A single monitoring point cannot represent all of them.
Connect network and security monitoring signals
Network failures and security issues often look similar at first. A DNS record change could be a legitimate deployment, a misconfiguration, or a compromise. A certificate issue could be a renewal failure, a misissued certificate, or a sign of poor control over domains. A sudden port exposure could be planned maintenance or an accidental firewall change.
That is why network and security visibility should not be treated as separate worlds. Operational teams need to see availability, configuration, and trust signals together. MyMonitor365 explores this overlap in more depth in its article on why network and security monitoring must work together.
For practical purposes, this means monitoring should not stop at uptime. It should also include signals such as SSL validity, DNS changes, exposed ports, suspicious configuration drift, and changes that affect trust.
Reduce alert blind spots without creating alert fatigue
More checks can create better coverage, but only if alerts are actionable. If every downstream service pages the team during one upstream outage, people stop trusting alerts. That creates another blind spot: the alert was sent, but no one treated it as important.
A healthier alerting model separates detection from notification. You still want incidents recorded, but you do not always want every related failure to generate the same level of urgency.
Good alert design includes:
- Clear severity levels based on business impact.
- Escalation paths for unresolved incidents.
- Maintenance windows for planned work.
- Alert integrations with the collaboration tools your team already uses.
- Dependency logic so one upstream failure does not create a flood of duplicate notifications.
Dependency-aware alerting is particularly useful when monitoring routers, gateways, firewalls, or parent hosts. If the parent is down, child alerts may not need to page every responder individually. MyMonitor365’s update on smarter alert suppression with monitor dependencies explains how this approach can reduce noise while still preserving incident visibility.
Do not let documentation become the next blind spot
Monitoring is only as useful as the response process behind it. If an alert fires and the responder does not know what the service does, who owns it, or what changed recently, detection still turns into delay.
Keep runbooks close to monitors. Each critical monitor should have enough context to help the responder act quickly: service owner, expected behavior, dependency map, recent maintenance notes, escalation contact, and rollback guidance.
AI tools are increasingly used to draft incident summaries, status updates, and internal documentation. That can save time, but teams should still verify technical claims against monitoring data and logs. For organizations thinking about AI-assisted writing policies, resources such as AI-writing detection and tooling overviews can help stakeholders understand the broader content-governance conversation. In operations, however, the source of truth should remain verified telemetry, audit trails, and documented changes.
A practical rollout plan for blind-spot-free monitoring
If your monitoring is incomplete today, do not try to fix everything at once. Start with the services that cause the most damage when they fail.
- Identify critical services: List customer-facing services, internal systems required for work, security gateways, DNS zones, APIs, and client environments that need proactive visibility.
- Map dependencies: Connect each service to its DNS records, ports, certificates, upstream providers, network paths, and responsible teams.
- Add layered checks: Combine ping, TCP, HTTP/API, SSL, DNS, keyword checks, and multi-location monitoring where appropriate.
- Set sensible alert rules: Define who gets notified, when alerts escalate, and which events should be suppressed during known maintenance.
- Validate from outside your network: Confirm that checks represent the user experience, not just internal reachability.
- Review coverage regularly: Audit monitors after migrations, DNS changes, certificate renewals, firewall updates, and new client onboarding.
- Test the response process: Simulate incidents and confirm alerts reach the right people with enough context to act.
This approach keeps the project manageable while steadily reducing risk.
Metrics that show whether your monitoring is improving
You can measure monitoring quality. The goal is not just more monitors, but fewer surprises and faster resolution.
| Metric | What it reveals | Healthy direction |
|---|---|---|
| Mean time to detect | How quickly monitoring identifies incidents | Lower |
| Mean time to acknowledge | How quickly humans or workflows respond | Lower |
| False positive rate | Whether alerts are trusted | Lower |
| Missed incident count | How often users report issues before monitoring | Lower |
| Coverage by service tier | Whether critical services have layered checks | Higher |
| Stale monitor count | Whether old or irrelevant checks create noise | Lower |
| Regional failure detection | Whether multi-location checks catch partial outages | Higher |
Review these metrics monthly or after major incidents. If users are still reporting issues before your monitoring does, that is a sign that a service path, geography, protocol, or dependency is still uncovered.
Where MyMonitor365 fits
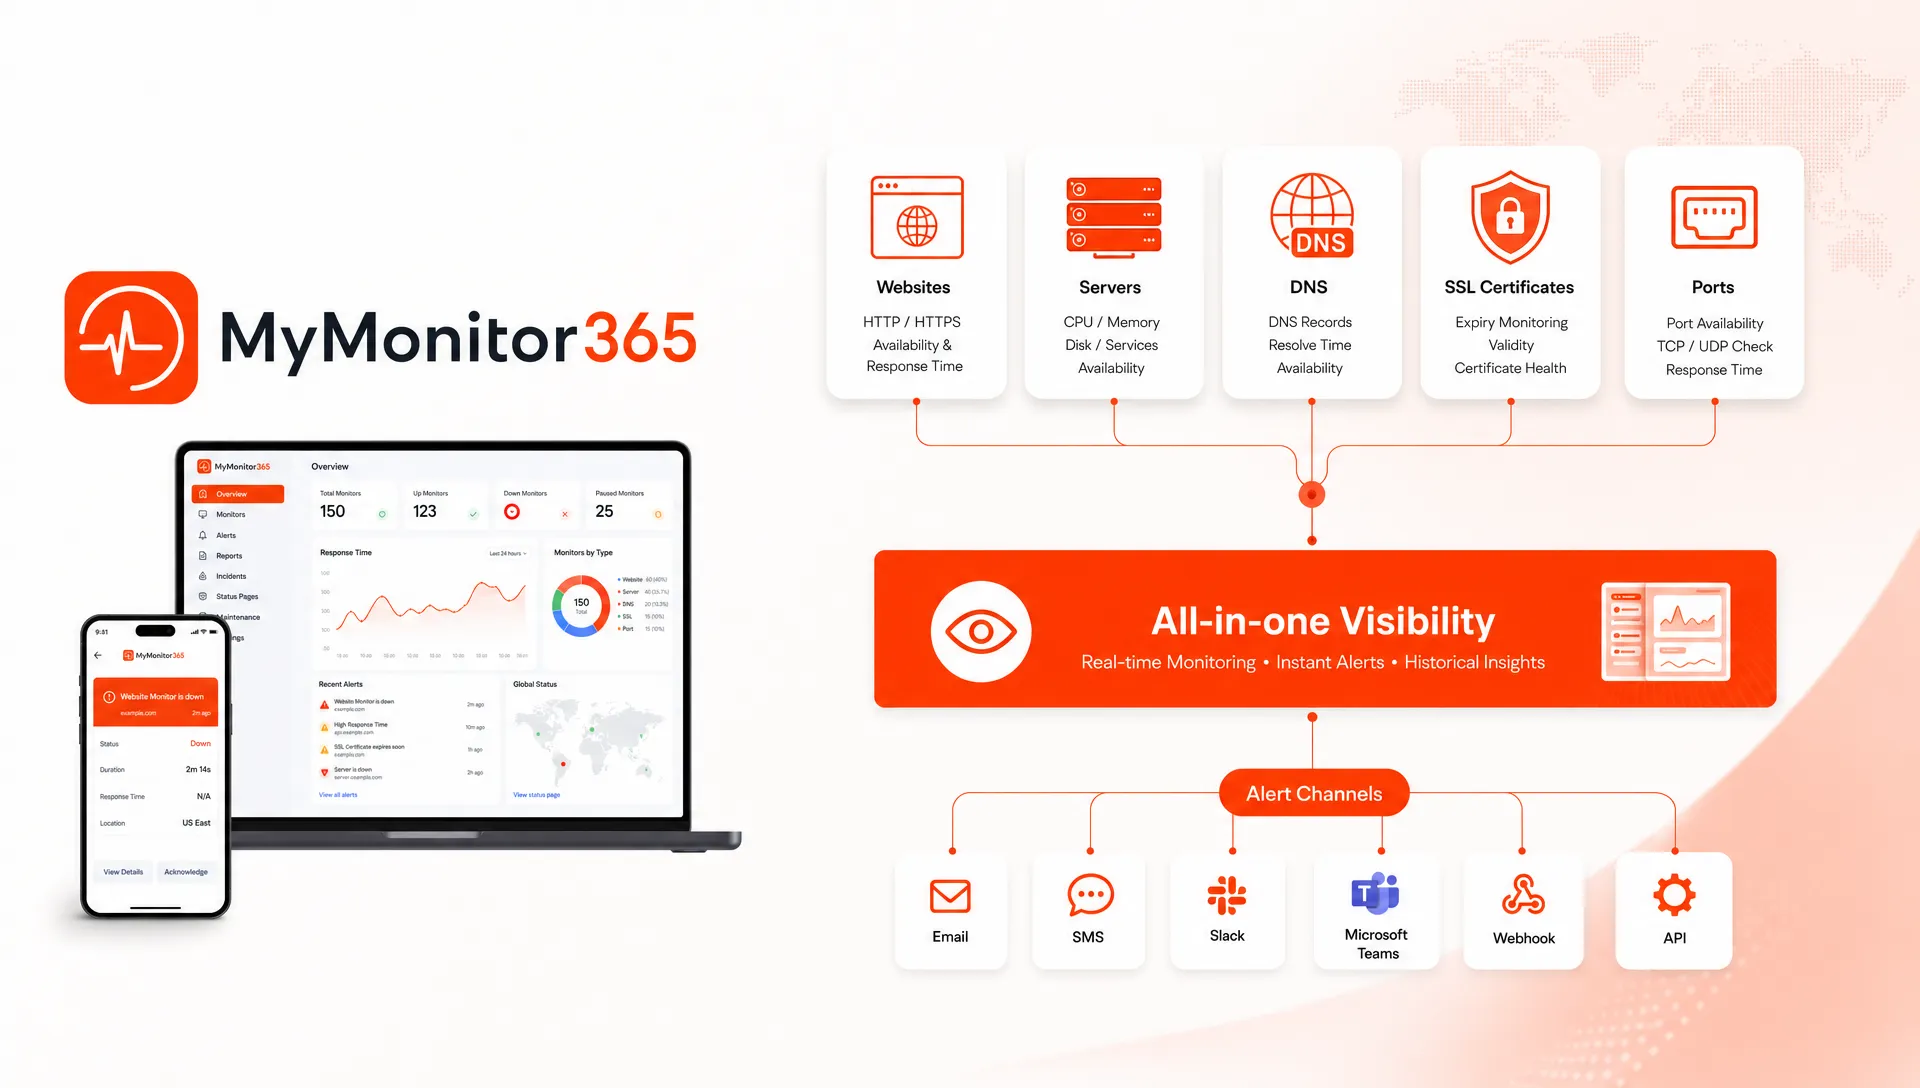
MyMonitor365 is built for IT teams and MSPs that need practical infrastructure visibility across websites, servers, DNS, SSL, and network services. It supports HTTP/API monitoring, ping and ICMP checks, TCP port monitoring, SSL security checks, DNS change monitoring, keyword content checks, multi-location monitoring, maintenance windows, audit logs, two-factor authentication, and alert integrations.
That combination helps teams move beyond single-signal uptime checks and toward layered monitoring that catches failures earlier. Whether you are responsible for one production environment or many client networks, the key is to monitor services from multiple angles and make alerts actionable.
Frequently Asked Questions
What is the biggest blind spot in network infrastructure monitoring? The biggest blind spot is relying on one type of check, such as ping, to represent service health. A host can respond to ping while the application, certificate, DNS route, or API behavior is broken.
How often should monitoring coverage be reviewed? Review coverage after every major infrastructure change, DNS update, certificate renewal, cloud migration, firewall change, or client onboarding. A monthly review is also useful for finding stale monitors and missing dependencies.
Is multi-location monitoring necessary for every service? Not every service needs it, but public websites, customer APIs, DNS-dependent services, and globally used applications benefit strongly from multi-location monitoring because failures can be regional.
How do MSPs avoid alert fatigue across many clients? MSPs should use service tiers, dependency-aware alerting, maintenance windows, clear escalation paths, and client-specific ownership context. The goal is to record all relevant incidents while only paging responders for actionable alerts.
Can DNS and SSL monitoring prevent outages? They can prevent many avoidable incidents by detecting expiring certificates, invalid SSL configurations, and unexpected DNS changes before users experience errors or traffic is misrouted.
Close your monitoring gaps before users find them
Blind spots are not solved by adding random checks. They are solved by understanding how each service works, where it can fail, and which signals prove it is healthy.
With MyMonitor365, you can monitor uptime, HTTP/API endpoints, ping and ICMP reachability, TCP ports, SSL certificates, DNS changes, keyword content, and multi-location availability from one platform. Start with your most critical services, layer the right checks, and build an alerting process your team can trust.
Explore MyMonitor365 and start reducing infrastructure blind spots before they become customer-visible outages.
Hashtags
#NetworkInfrastructure #InfrastructureMonitoring #UptimeMonitoring #NetworkMonitoring #MSPTools #ITOperations #IncidentResponse #DNSMonitoring #SSLMonitoring #MyMonitor365